Take the sheet (foglio) and parcel (particella) numbers from the cadastral record or the deed
(if you do not have them: search by person, €4.90).
E.g. «Fg. 4 part. 102»: sheet 4, parcel 102. If you only have the address,
start from that.
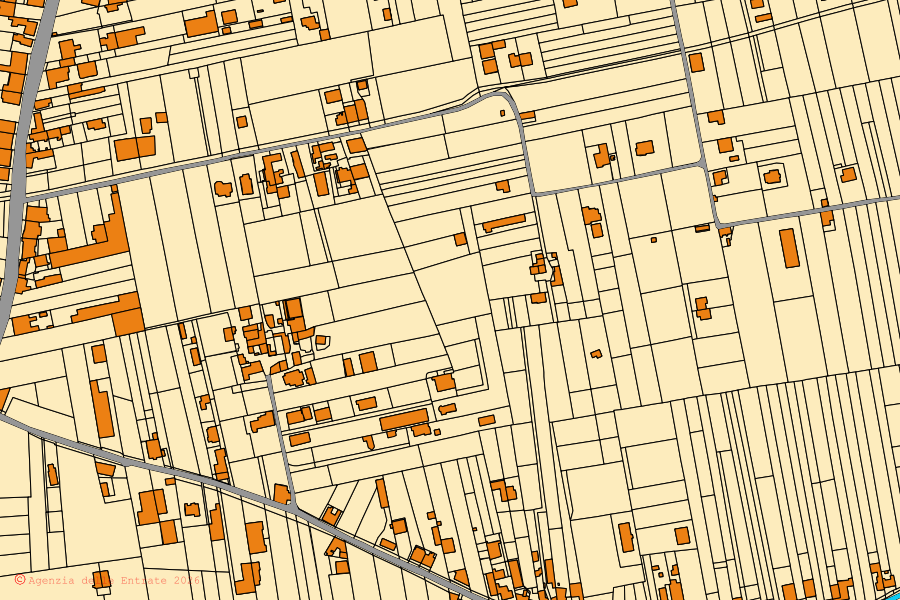
Type them in the box below, or open them on the cadastral map of Pompei, where you pick the sheet from the list of those that exist.
Click the parcel for its boundary, area, OMI price ranges for the zone,
seismic zone and constraints. For land where you only know the position,
the boundaries can be read from the point.
The cadastral map is the official one from the Agenzia delle Entrate (Italian Revenue Agency).
For a document with legal value you need the
visura catastale (cadastral record, €4.90):
the data on this page is for orientation.
No SPID (Italian digital identity) needed. Pay by card, from abroad too.
Home prices in Pompei
OMI price ranges by zone
Standard homes (abitazioni civili) in Pompei: €1,300-3,200/m²(OMI 2025/2 · median for the province of NA: €1,250-1,900/m²)
Click a zone to open the map there.
Colour = price of standard homes
€1,625→2,650/m². Grey: no price.The 4 zones in detail, with their streets
Zone B1 (zona santuario, via roma, via lepanto, primo tratto via nolana, via sant`abbondio): €2,100-3,200/m²
Zone C1 (semicentro settentrionale, fascia autostrada, piazza porta marina inferiore, zona auchan): €1,700-2,600/m²
Zone D1 (tre ponti - chiesa della giugliana): €1,300-1,950/m²
Zone D2 (fontanelle - casone - messigno - mariconda): €1,350-2,050/m²
Use
Price range
Abitazioni civili
€1,300-3,200/m²
Abitazioni di tipo economico
€870-2,200/m²
Box
€640-1,800/m²
Capannoni tipici
€400-850/m²
Laboratori
€420-850/m²
Magazzini
€295-910/m²
Negozi
€810-3,300/m²
Uffici
€1,450-2,900/m²
Ville e Villini
€1,350-3,300/m²
Price ranges by homogeneous zone, per square metre of gross floor area, for the ordinary
market; where the municipality has several zones the table shows the overall range.
Source: Agenzia delle Entrate, OMI (official price survey), half-year 2025/2.
Significant earthquakes are possible, though less frequent than in zone 1. New buildings must meet full anti-seismic requirements; for older buildings, the year they were built (and the rules in force then) matters a great deal.
Landslides and floods in Pompei
ISPRA · IdroGEO, national mosaic
Share of territory and residents in hazard areas. For a single parcel: the map.
Landslides P3–P4
0.0%
of the territory in areas of high or very high landslide hazard (0.0 km²)
Floods P3
0.9%
of the territory in areas that flood in the frequent scenario (0.1 km²)
Residents in landslide areas
0
people in classes P3–P4 (0.0% of the population)
Residents in flood areas
5,218
people in the medium scenario P2 (20.5% of the population)
71 more procedures in the same area are closed or no longer open to bids (no bidders, sold, suspended).
Reserve price of a hectare of land
Land
Reserve price
Sample
with a building on it, in the region
€34,544/ha (half fall between €30,886 and €131,799)
6 procedures, 8 lots, 13 ha measured, usually at sale attempt no. 3
These are reserve prices, not prices paid: an appraiser's estimate, already reduced after
sales with no bidders. Only lots where every parcel was found; a procedure counts once.
Across the wider province, of
387 completed court sales on record,
40% had no bidders; those sold went at a median discount of 21% on the reserve price (72 cases).
Free alert for new auctions in Pompei or within a radius you choose. An email address is needed.
Public properties in Pompei
MEF · Demanio · ANBSC
181 properties of municipalities and local bodies, of which 75 declared unused and 32 unusable
101 belonging to public housing bodies
62 State buildings and sites
Assets confiscated from organised crime: 31 already transferred to public bodies (4 not in use), 38 still managed by the national agency
The state of use is declared by each body to the Ministry of Economy (census at 31 December 2023); State buildings and sites come from the Agenzia del Demanio (at 31 December 2025); confiscated assets come from the national agency (ANBSC, openRegio). It does not mean that a property is vacant or for sale.
 Open the map →